Codecannon can be used to build a variety of apps. While the out of the box applications most closely resemble administrative or data-entry-heavy applications, there's still a lot of tooling, that can be used in completely custom applications.
Today we'll be looking at a case study of Manuela, and how using Codecannon aided the team in developing their app.
Background
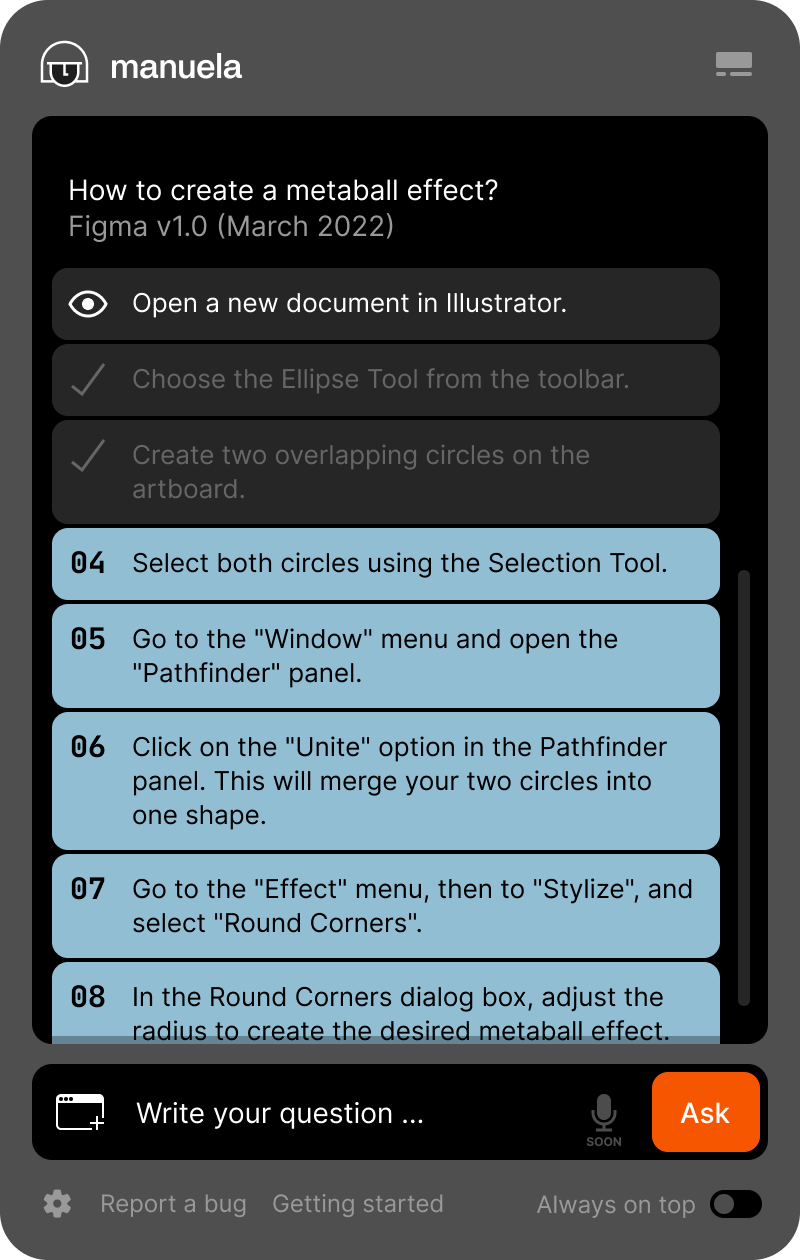
The manuela team came to us with a not-so-simple request. They wanted to build an AI assistant, that would help their users use desktop software, by outlining actions the users need to take to accomplish a specific goal. Using chat steps, and highlighting elements on screen that the users need to click to carry out their desired process, Manuela helps users pick up new software quickly.
We discussed their idea, and come to the conclusion that Codecannon could be helpful in their endavour.
Manuela Assistant
Project structure
We devised a plan on how to build the application and figured out a few ways that Codecannon could help.
Electron frontend
It was a requirement for the Manuela team that the app be an electron desktop app, as they wanted the assistant to help with desktop software like Blender.
While electron is not supported out of the box, due to Codecannon apps shipping a SPA Vue frontend, this turned out to be a relatively straightforward process. The entire Vue application could be mounted inside the electron window, and with a bit of configuration, we had the generated application running inside Electron.
Laravel backend
The team was open to different API frameworks, but ultimately decided that Laravel was a great fit, due to the sheer amount of features, and easy to set up essential systems like auth, and queues.
As a consequence, Codecannon was an obvious choice. It takes the ease of setup for these systems even further than the framework itself. The team decided they wanted to get to work, on unique feature, as soon as possible. They used Codecannon to bootstrap the common features that are required, but are, essentially, highly complex boilerplate.
Python AI backend
Python was identified as a perfect fit for the computer vision pipelines that the team needed to build. While Codecannon doesn't offer any python service generation, the service was easy to set up and integrate into the Codecannon developer environment and deployment configuration.
Custom design system
The Manuela team has a strong design team, so it was reasonable they wanted to design a completely bespoke design system for the application.
While the design system had to be built from scratch, it was easy to implement the custom views within, the generated Vue SPA. This allowed the team to use many of the API communication helpers that ship with Codecannon apps. With this, the team to focus on component logic, and differentiating features, rather than on the API communication business logic layer.
Back-office modules
While the user facing part of the application was designed using a completely custom design system, the back-office modules for user, chat and resource limits management, were generated and upgraded slightly, but still retained the majority of the code generated by Codecannon.
This allowed the team to only make minor modifications for the team facing, less UX intensive parts of the application, and ship a working product more quickly, while still having an overview over the usage of the application, and the ability to manage users and AI spend.
API
The application needed an API, as the processing of user requests, and different AI service communication still needed to happen on a central service.
The manuela team leveraged the generated API capabilities heavily, and added custom functionality where needed, with ease.
There was some backend and frontend tweaking they needed do to support the features they wanted, but all in all, the generated API still did a lot of heavy lifting, and enabled them to harness the power of Laravel with ease, usually maintaining the sensible defaults generated by Codecannon.
Authentication
The team was able to use the out of the box generated authentication, making only minor modifications to the frontend route guards to lock non-admin users out of the back-office part of the app; and adding some custom functionality for user usage tracking and limits.
Computer vision service
The computer vision part of the application responsible for detecting the buttons on screen that needed to be highlighted for the users, happened in a Python service.
The python service was not generated by Codecannon itself, but the pre-configured docker and kubernetes configs made adding this service to the existing stack a breeze. With a Dockerfile, a few lines of configs in the docker-compose.yml file, and just a couple of kubernetes configs the service was up and running.
CI/CD
While there were some additions needed in the CI/CD configuration of Manuela, due to the building and publishing requirements for Electron, the project kept all the generated CI/CD workflows and actions for all of the generated parts of the application.
While CI/CD actions for deployment to DigitalOcean didn't come with the generated application, we provided them to the team, and they were shipping the application in staging and producion the same day they decided to do it.
Developer environment
As mentioned above, adding the additional Dockerfile and docker-compose configs was easy and straightforward. The team could build and run the entire Docker stack locally with a single command, making development straightforward, and the app easy to set up on different machines, with just a few changes to the .env files for secrets.
Overall outcome
The team was able to ship the product in a few months, and didn't have to worry much about the initial project setup. With the exception of the custom UI and computer vision/LLM communication functionality, the team was able to pick up the generated app and run with it, saving weeks of work on setting up the API, connecting it to the frontend, figuring out authentication, setting up deployments, writing the CI/CD pipeliens, and building a great local developer experience.